I’m very excited to introduce what I’ve been working on behind the scenes this season: The Faceoff Project. My interest in faceoffs started over the offseason when I dove into some areas of the game the Ducks struggled at. Their special teams last season were very poor, and one of my theories as to why they were so bad was that they were not a good faceoff team. That led to an analysis of the impact of faceoffs on special teams performance, which you can read here. I was able to show, statistically, that faceoff ability did have some effect on special teams efficiency.
In a more recent post, I dove into 5 areas where the Ducks could improve this season. One of those areas was faceoffs. The Ducks were a bad faceoff team last year, and all signs pointed to them being even worse this season. The Ducks’ centers are pretty young, and generally speaking, younger players are worse at winning faceoffs because experience plays a big part in faceoff ability.
I wanted to dive deeper into faceoff numbers to find patterns and trends, but there isn’t much publicly available outside of faceoff win percentage by zone (offensive, defensive, neutral) and by game situation (even strength, power play, penalty kill). I knew that if I wanted to uncover meaningful insights, I had to take matters into my own hands.
Introduction
That’s right, I made the clinically insane decision to manually track every single faceoff the Ducks take this season. This means that I have to actively watch and record details for each faceoff, and there are typically 50+ faceoffs in every game. The most important step was determining which variables to keep track of beyond just who won and lost the faceoff. Here is a screenshot of 1 period’s worth of data in my spreadsheet, followed by an explanation on each variable I track:

- Game – Game number of the season for the Ducks (ex: Game #5 = 5)
- Opp – Team the Ducks are playing in that game
- Location – Indicates if the game is at home or away
- Period – Period in the game when the faceoff took place
- Time – Time on the clock for the faceoff
- DecTime – Time converted to a decimal number to allow for quantitative analysis (ex: 11:30 left on the clock translates to 11.50)
- Score – Differential in score at time of faceoff (positive number indicates Ducks are in the lead, and negative number indicates trailing)
- Reason – Cause for the stoppage that leads to the faceoff
- Situation – Number of skaters on the ice for each team during faceoff (indicates even strength, special teams, empty net, etc.)
- Player – Name of Ducks’ player who took the faceoff
- Hand – Handedness of the Ducks’ player
- OppPlayer – Name of opposing player who took the faceoff
- OppHand – Handedness of opposing player
- Zone – Part of the ice the faceoff took place in (Offensive, Defensive, or Neutral Zone)
- Side – Side of the ice the faceoff took place in from a Ducks’ perspective
- Strong – Indicates if the Ducks player is taking the faceoff on his strong or weak side
- OppStrong – Indicates if the opposing player is taking the faceoff on his strong or weak side
- Kick – Indicates which (if any) Ducks player was kicked out of the faceoff circle
- OppKick – Indicates if an opposing player was kicked out of the faceoff circle
- Result – Official record of the result of the faceoff from a Ducks’ perspective (“Win” means the scorer recognized it as a win for the Ducks’ player, and “Loss” means the scorer recognized it as a loss for the Ducks’ player)
- Clean* – Indicates if the draw was won cleanly
*This is a relatively arbitrary variable that is based on my opinion. From my perspective, simply saying a team won or lost a faceoff is not enough detail. Adding this variable doubles the number of possible results from a faceoff (clean win, clean loss, unclean win, unclean loss). Everyone would agree that it is better to get a clean win rather than an unclean win, as that gives the team easier possession. My definition is as follows: “A faceoff win is considered clean if the team officially credited with the win gets initial, legitimate possession of the puck.” It’s not perfect, but that definition works for the majority of faceoffs.
Season Overview
Before I get into some of the finer details of my data, I’ll just start by going over the Ducks’ general performance in the faceoff circle. Through 14 games this season, the Ducks have taken 809 draws, winning 346 of them for a win percentage of 42.77%, good enough for dead last in the NHL.
Here is the breakdown by player (listed in alphabetical order):
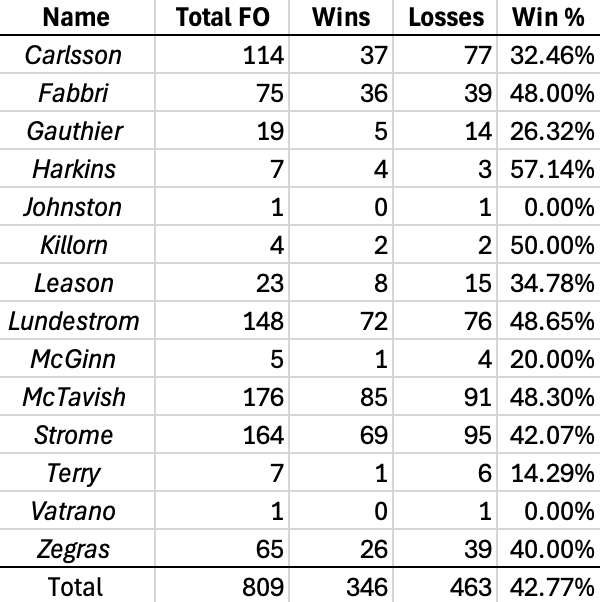
All of Leo Carlsson, Jansen Harkins, Brett Leason, Isac Lundestrom, Mason McTavish, Ryan Strome, and Trevor Zegras have spent time playing center this season. The rest of the players on the list have taken faceoffs as a result of centers getting thrown out of the faceoff circle (Robby Fabbri and Cutter Gauthier have taken some draws as wingers, too).
As you can clearly see, the Ducks don’t have anyone who excels in winning faceoffs. Of the regular faceoff takers, Fabbri, Lundestrom, and McTavish have passable win rates, but none of them would be considered aces. Fabbri, in particular, has been an interesting case because he has taken more draws as the season has gone on, especially in high leverage situations. Carlsson, Strome, and Zegras have all struggled mightily at winning faceoffs, though Zegras has done better in his recent games now that he has gotten more comfortable at his usual center position again (47% win rate in his last 4 games). Overall, this is a bad faceoff team, and it has had an adverse effect on the team’s ability to possess the puck, compounding the other warts in the team’s game.
I’ll now go through each of my tracked variables and discuss some insights and thoughts I have about the data at a team level and an individual level (I will be focusing on the 6 players who have taken more than 50 draws: Carlsson, Fabbri, Lundestrom, McTavish, Strome, and Zegras).
Game Location
Explanation: There is only one part of the rulebook that relates faceoffs to home/visiting teams: for a faceoff at center ice, the home team’s center decides whether to put his stick down 1st or 2nd. Home teams also get the last change, meaning they essentially determine the matchups on the ice for each faceoff. The only other differences regarding faceoffs in home or away venues would be psychological, either with the players or the referees/linesmen dropping the puck. With that in mind, there should be some discrepancy between home and away faceoff numbers, but nothing extreme.
Team Level: Here are the faceoff splits for the Ducks this season at home versus on the road:
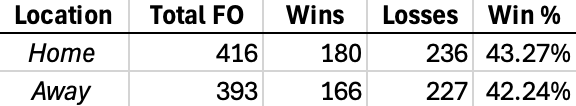
The numbers are pretty similar, and the small difference could just be attributed to the faceoff abilities of the opponents they faced so far. On a team level, there doesn’t appear to be a major statistical difference.
Individual Level: Some players definitely seem to perform better in one situation versus the other. Carlsson (38.1% vs. 25.5%), McTavish (51.6% vs. 46.6%), and Zegras (45% vs. 32%) all do better at home than on the road. This could be attributed to advantageous matchups they are given because they are the home team. Strome is the one regular center who does noticeably better on the road (48.7%) than at home (35.7%). Maybe it isn’t a coincidence that the 3 centers who do much worse on the road happen to be the youngest, most inexperienced centers on the team. I will definitely keep an eye on that as the season goes on.
Period
Explanation: I mainly included the period of the game in my tracking to help organize the data, but I also wanted to see if there were any trends in win percentage or faceoff volume. Other than changing sides of the ice, period changes don’t seem to have any direct or obvious effects on faceoffs.
Team Level:
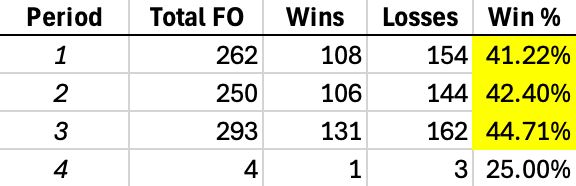
I was honestly a little surprised at the data here. There does seem to be a modest upward trend for the team as the game goes on. One explanation for this is that the team is likely to be more picky about who takes faceoffs the deeper they are into the game. Generally speaking, a faceoff in a tie game in the 3rd period means more than a faceoff in a tie game in the 1st period, so you would probably want someone who is more likely to win the draw to take it later in the game.
Individual Level: Fabbri, Lundestrom, and McTavish are the best regular faceoff men on the team so far this season, so it isn’t a surprise that they take more faceoffs in the 3rd period than they do in any other period. 56% of Fabbri’s faceoffs have taken place in the 3rd period, and it’s 37% for Lundestrom and 39% for McTavish.
Looking at winning percentage by period, there are a couple of outliers in the data. Fabbri does much better in the 3rd period (52% vs. 42% in other periods), Carlsson in the 2nd period (37.5% vs. 28% in other periods), Lundestrom in the 1st period (56.8% vs. 45% in other periods), Strome in the 3rd period (50% vs. 38% in other periods), and Zegras in the 1st period (50% vs. 34% in other periods). I don’t have a great theory on these numbers yet, and it’s also very possible that they flatten out as the sample gets bigger.
One other important detail I haven’t mentioned yet is faceoffs in overtime. Only 4 total draws is obviously an incredibly small sample, but they are so important to win that I feel like it’s necessary to point out. Puck possession is critical in 3-on-3, and it’s tough to get the puck if you don’t start with it. Most teams have 1 or even 2 guys they can rely on to win the majority of draws, but the Ducks don’t have anyone like that. Some teams will send out a player just to take the draw and get off the ice because it’s that important. With Anaheim’s current center group, it will be hard for them to compete regularly in the faceoff circle in overtime when other teams are almost certainly sending out an ace to win it.
Time Left in Period
Explanation: Like the period variable, I mainly included time left on the clock as a bookkeeping statistic, but I decided to see if the team’s faceoff efficiency changes throughout a period. Nothing within the rules suggest that there should be any discrepancy in winning percentage based on the time of the faceoff.
Team Level:
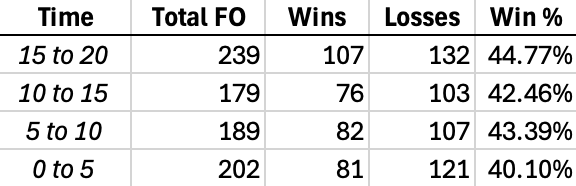
Note: To help explain the table, “15 to 20,” for example, refers to when there is between 15:00 and 20:00 on the clock at the time of the faceoff. So “15 to 20” is the first 5 minutes of the period, and “0 to 5” is the last 5 minutes of the period.
Anaheim seems to do slightly worse in the faceoff dot at the end of periods. This somewhat runs counter to my reasoning in the last section where I suggested the Ducks are more careful about who takes faceoffs later in games. It seems like other teams bear down more at the end of periods to win key draws.
Individual Level: Looking at faceoff volume, there isn’t a huge discrepancy based on time for most of the players, but there are a few outliers. Carlsson’s volume decreases as periods go on, while Fabbri’s goes up. That makes sense as they have played together for a few games and Fabbri occasionally took draws for Carlsson. Lundestrom also takes more draws more often at the end of periods. McTavish takes more draws in the 1st half of periods, and Zegras takes more in the 2nd half. Nothing too interesting to report here.
Getting into win rates, there are a few outliers here. Carlsson performs slightly better in the 2nd half of periods. Fabbri wins over 50% of his draws in the first three-quarters of a period, but only wins 41% of his draws in the last quarter. Like Fabbri, Lundestrom also does poorly at the end of periods compared to the rest of the game (he has won 13 of 42 draws in the final 5 minutes of periods for win percentage of 31%). On the other end of the spectrum, Zegras has won 11 of 18 draws in the final 5 minutes of a period (61% win rate). It’s still too early in the season to draw any conclusions here, especially because the team is still figuring out who the best faceoff men are, but you hope the Ducks improve later in periods as the season goes on.
Score
Explanation: The main reason I wanted to track the score of the game was to see how the team does in close game situations where faceoffs are more important.
Team Level:
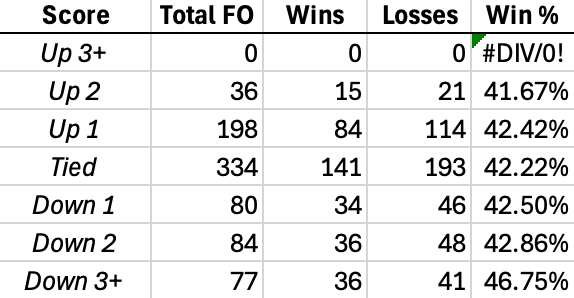
Most of the numbers here are in the same ballpark, with the one exception when the Ducks are trailing by 3 or more goals. This makes sense because the game is likely out of reach at this point, so opponents are playing lesser used players more often. Teams winning by that much also won’t feel the desperation to win faceoffs as much as they would in closer games.
Individual Level: I will analyze this variable by taking a look only at the faceoffs that were taken when the score was within 1 goal.
First, let’s see some numbers from faceoffs taken when the Ducks trail by 1. McTavish is clearly the favorite center to use in this situation, as he has taken 30 of the 80 draws (37.5%). Carlsson and Strome are the only other players who have taken more than 10 draws in that situation. Those 3 generally center the 3 scoring lines for the team, so it makes sense that they are out there when the team is trailing. The sample is too small to take anything away from win rates.
When the game is tied, faceoff duties are more spread out. Strome (80) and McTavish (71) have taken the most, with Lundestrom (59) and Carlsson (48) trailing behind them. Strome has only won 40% of these draws, and Carlsson has won a pitiful 27%.
With the way the team has played, it is surprising that the Ducks have taken so many more draws when they are leading by 1 than when they are trailing by 1, but that is more of a testament to the team’s goalies than anything else. Lundestrom gets a greater share of these draws as he’s known more as a defensively responsible center. Other than that, there is nothing else that stands out.
Faceoffs after Icings and Penalties
Explanation: This is the first variable in this list that I think is legitimately important to analyze. I record the reason for the whistle of each faceoff, and while most of them don’t make a material difference to faceoffs, there are 2 that do: penalties and icings. In both scenarios, the team that took the penalty or iced the puck is at a significant disadvantage. Not only is the faceoff guaranteed to be in that team’s defensive zone, but the offensive team gets to pick which side of the ice to take the draw on, meaning it will almost always be on the strong side of the opponent. And with icings, the team that iced the puck cannot change players, meaning they are potentially tired, too. These 2 scenarios give great opportunities to the offensive team to gain possession in the offensive zone and generate offense.
Team Level:
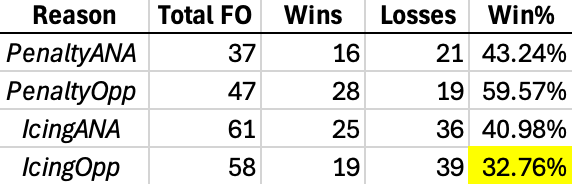
On the opening faceoffs of Duck penalty kills, Anaheim wins 43.24% of draws, which is probably to be expected given the disadvantage. On the other side of the coin, the Ducks have done a great job at winning the 1st faceoff on their own power plays (59.57%).
When the Ducks ice the puck, they win about 41% of those draws in the defensive zone. However, the number that really sticks out here is the Ducks’ faceoff percentage when their opponent ices the puck. A 32.76% win rate is honestly incredible, and it is hard to fathom how this is even possible. It’s not just bad, it’s well below the win rate of the 2 disadvantageous situation I just outlined. This is a statistic that really needs to improve because that represents a lot of missed opportunities to gain possession and capitalize on a tired defense.
Individual Level: First, we will look at what the Ducks do when they take a penalty. Lundestrom is the clear #1 option as he has taken 26 of the 37 draws. Of the 26, he has taken 24 of them on the right side (his weak side) because most of the centers he goes against are lefties. Lundestrom has won 10 of the 26 draws (38.5%) he’s taken. Strome is the only other center that has taken more than 1 faceoff in this situation (he likely takes them when Lundestrom is either injured or in the penalty box). He has won 5 of 8 faceoffs, all of which were on the right side (his theoretical strong side). Maybe he should take some more going forward.
Next, let’s see what the Ducks do when they go on the power play. McTavish is the go-to-guy here, taking 26 of 47 draws. He has done well, winning 16 of them for a win rate of 61.5%. Ryan Strome is next with 10 faceoffs, winning 6 of them. McTavish has expectedly taken all 26 of those faceoffs on his strong side. Curiously, Strome has taken 6 on his strong side and 4 on his weak side. Strome might base his choice on the opposing center more than anything else.
Let’s move on to icings. First, we will look at when the Ducks ice the puck. The majority of these faceoffs (50 of 61) take place on the Ducks’ right side of the ice, meaning Strome is the only one who gets to take these on his strong side. This partially explains the poor numbers in this situation. Strome (8 out of 15) and Lundestrom (7 out of 12) are the only ones with winning records when the Ducks ice the puck.
Lastly, we will now address the elephant in the room: how do the Ducks do so poorly on faceoffs after their opponent ices the puck? The top 6 faceoff takers on the team have all taken at least 5 of these draws. Strome (15) and McTavish (12) have taken the most, and neither of them have had success. Each of them have only won 4 of their draws. Lundestrom has the best record with 5 wins in 8 attempts, but the rest of the team is very poor. Carlsson has won 1 of 8 draws, and Zegras has won 1 of 6. Once again, everyone chooses to take these draws on their strong side, except Strome on occasion (he has won 1 of 4 on his weak side). I’m not sure what the answer is here, but this is an area that the team should be much more successful in.
Manpower Situations
Explanation: Winning faceoffs is more important in certain manpower situations. Special teams and overtime play, in particular, are aided by winning faceoffs.
Team Level:
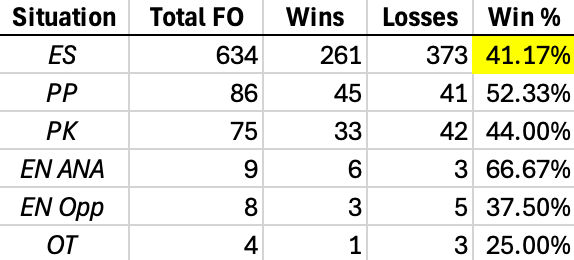
Both the power play and penalty kill win rates are a bit lower than NHL average, but they aren’t bad. However, the even strength win rate is very bad, easily dead last in the league.
Individual Level: At 5v5, the Ducks have a lot of poor performers. Only 2 of their top 6 faceoff takers are above 40%: McTavish at 46.2% and Lundestrom at 52.6%. They all need to pick up the slack.
On the power play, McTavish (40) and Strome (20) take the majority of draws. McTavish has won 55% and Strome has won 50%. Zegras has recently started taking some faceoffs on the power play. He has won 3 of 4 that he has taken, so maybe he is another option going forward.
On the penalty kill, Fabbri (12), Lundestrom (41), and Strome (12) are the main faceoff men. Fabbri has won 58.3% of his faceoffs, Lundestrom has won 39.0%, and Strome has won 41.7%. Lundestrom is clearly the guy that Cronin trusts the mosts in these situations. I wonder if he starts giving Strome or Fabbri more chances to win draws on the penalty kill.
Handedness
Explanation: I also wanted to see if some Duck players perform better against either righties or lefties, regardless of what side of the ice the faceoff takes place on. This could maybe indicate a mechanical or tactical flaw in the way the player takes the draw when faced with a certain handed opponent.
Team Level:
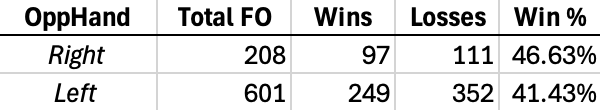
As a team, the Ducks perform much better against right-shot opponents. This is to be expected with a group of centers that are mostly left-shot. Whenever a right-shot opponent is on his strong side, this likely means the Duck center is also on his strong side. And the poor results against left-shot centers is also unsurprising for similar reasons.
Individual Level: For the most part, there is not too much discrepancy in how Duck centers perform against lefties and righties. There are 2 exceptions, however. Fabbri wins 41.8% of draws against lefties and 65% of draws against righties. Lundestrom wins 46.2% of draws against lefties and 58.6% of draws against righties.
Strong Side vs. Weak Side
Explanation: Players generally have a preference on which side of the ice they take a faceoff. Right-shot players usually prefer the right side of the ice and left-shot players usually prefer the left side of the ice. Players are stronger winning draws with their backhands and it’s safer to win them toward the boards. With the Ducks only having 1 regular right-shot center (Strome), I wanted to see how often Ducks’ centers were able to take faceoffs on their strong side and how they performed on each side.
Team Level:
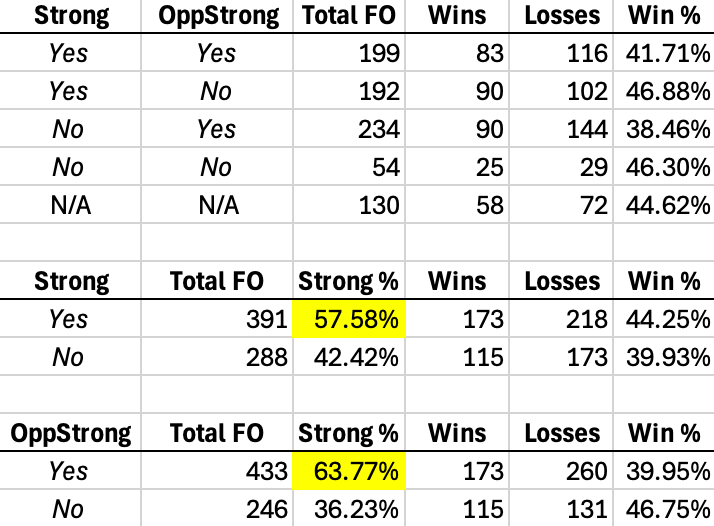
The 1st table details how the team fares in different strong side matchups. For example, the first row shows the stats when both Anaheim’s center and the opposing center are taking the draw on their strong sides (for clarity, N/A vs. N/A indicates the draw was taken at center ice). Unsurprisingly, the Ducks are at a disadvantage in every situation, especially when the opposing center is on his strong side.
The 2nd table shows how often the Ducks take draws on their strong sides, and the 3rd table shows how often the opposing team takes draws on their strong sides. Opponents have the advantage in strong side frequency by a notable amount (63.77% vs. 57.58%). This is directly related to the face that Strome is the only regular right-shot center on the team. That means the majority of faceoffs the Ducks take on the right side will be on their center’s weak side. Let’s see what the numbers look like based on the side of the ice the faceoff is on:
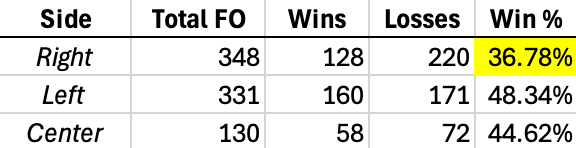
It’s even worse than I would’ve thought. Anaheim is a much more respectable faceoff team if you take out the draws on the right side of the ice. Unfortunately, you can’t do that, so either the current players need to improve in that area, or the team needs to find someone who can win draws on the right side of the ice.
Individual Level: First, we will take a look at how Duck centers perform on their strong sides. Fabbri (59.5% win rate) and Lundestrom (60.4%) are easily the best in this category. Carlsson (32.7%), McTavish (48.9%), and Zegras (41.7%) all perform around their total rate. Strome, however, is quite an outlier here. The one right-shot center the Ducks have is winning only 36.8% of his draws on his strong side, which exacerbates Anaheim’s faceoff futility on the right side of the ice.
Looking at performances on weak sides, pretty much every player gets worse, which is to be expected. Carlsson (24.3%), Fabbri (33.3%), and Lundestrom (41.4%) take the biggest hits. The one exception, once again, is Strome. He wins 52.1% of draws on his weak side.
For draws at center ice, Carlsson (42.9%) and McTavish (51.5%) perform better than normal, while Lundestrom (44%) performs worse.
When opponents are on their strong side, most Duck centers perform slightly worse than their season averages. The one exception is McTavish, who is much worse at 41.1%.
On opponents’ weak sides, most of the team performs better than they average. Lundestrom (56.8%), McTavish (54.3%), and Strome (48.4%) all do noticeably better in this situation.
Zone Location
Explanation: Offensive and defensive zone draws are generally more important than draws in the neutral zone because they take place closer to goals. Teams have set plays off faceoffs, so winning draws would disrupt those coordinated attempts.
Team Level:
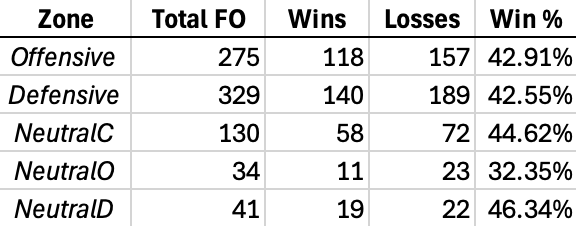
Note: “NeutralC” refers to faceoffs taken at center ice, “NeutralO” refers to faceoffs taken on the offensive side of the neutral zone, and “NeutralD” refers to faceoffs taken on the defensive side of the neutral zone.
Unsurprisingly, the Ducks have taken more faceoffs in the defensive zone (329) compared to the offensive zone (275), and the ratio is even worse if you only look at the 5v5 numbers (248 vs. 189). This is a result of the Ducks’ inability to possess the puck and keep it at their opponent’s end of the ice. The disparity between offensive and defensive zone draws is a good barometer for puck possession.
In terms of win rates, there isn’t much of a difference between the offensive zone and the defensive zone, and they are both close to the team average. The only numbers that stand out here are the “NeutralO” and “NeutralD” win rates, but the sample isn’t big enough to draw any conclusions there yet.
Individual Level: To remove special teams bias, I will be looking at 5v5 numbers. Because of the disparity in offensive and defensive zone draws, pretty much everyone on the team takes more draws in the defensive zone. McTavish and Strome, in particular, take a greater share of faceoffs in the defensive zone than their teammates.
In terms of win rates, there are a couple of players who seem to do better in one zone versus the other at 5v5. Fabbri does better in the defensive zone (42.3% vs. 25.0%), McTavish performs better in the offensive zone (51.4% vs. 40.7%), and Zegras does much better in the defensive zone (50.0% vs. 22.2%).
Kicked from Faceoff
Explanation: An underrepresented aspect of faceoffs is players getting kicked out of the dot. If a center is thrown from the faceoff circle, that forces a winger, who is usually not as experienced in taking faceoffs, into taking the draw. Theoretically, this should give a notable advantage to the other team who still has its center taking the draw.
Team Level:
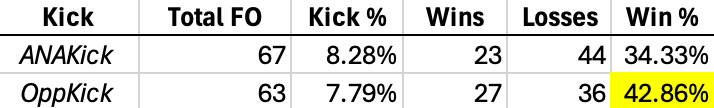
The 34.33% faceoff win percentage when a Duck is kicked out of the faceoff circle is unsurprising. However, the fact that Anaheim only wins 42.86% of draws when the opposing center gets kicked out of the circle is disappointing. There are definitely some wingers who are good at winning faceoffs, but the Ducks should still be winning the majority of these draws.
Individual Level: Nobody has taken more than 15 draws against a player who was kicked out of the faceoff dot, but it is clear who is dragging this statistic down. The 2 centers with the most reps in this category are Carlsson and Strome, and they are also the only centers of the 6 I’m analyzing who are under 50%, and neither of them are close (Carlsson has won 3 of 15 and Strome has won 3 of 12).
I have also been keeping track of which Ducks players get tossed from faceoffs the most. Without question, McTavish is the biggest culprit in this area. Of the 67 times a Ducks player has been kicked out of the circle, 30 have been McTavish, equating to 14.56% of his faceoffs. This is something he needs to work on because his effective face percentage (the percentage of faceoffs the Ducks win when McTavish lines up to take the draw, regardless if he ends up taking it or not) is unquestionably lower than his actual percentage.
After McTavish, Zegras gets kicked out most often (9.72% of the time), then Lundestrom (8.64%), then Strome (5.75%). Carlsson only gets kicked out 2.56% of the time, which seems like a good thing on the surface, but given Carlsson’ poor faceoff record, this could be a result of Carlsson not pushing the boundaries of winning draws. As Carlsson gains experience and adds more tricks to his bag, he will try new things and probably get tossed out of the circle more.
Clean Wins and Losses
Explanation: As I mentioned earlier, not all faceoff wins are created equally. Some wins allow for smoother possession than others, and I wanted to create my own measure beyond wins and losses to account for this. Here is my definition once again: “A faceoff win is considered clean if the team officially credited with the win gets initial, legitimate possession of the puck.”
Team Level:
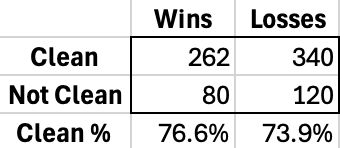
The Ducks win 76.6% of their faceoff wins cleanly, and their opponents win 73.9% of their faceoffs wins cleanly. One argument here is that the Ducks do a better job of gaining possession of the puck after faceoff losses than their opponents do. One thing I have noticed in tracking these faceoffs is that opposing centers have been likelier to win draws off of the linesman’s skates, which usually gives the Ducks’ center another chance to win the puck. I’m still trying to figure out what I can learn from this statistic, but it’s nice to have.
Individual Level: For faceoffs that I consider clean, the win percentage of Anaheim’s centers is pretty similar to their overall rates. The one exception would be Zegras, who wins 47.1% of clean draws and only 40% of his total faceoffs.
For faceoffs that I consider unclean, there are a few players who have lower win rates than their totals. All of McTavish, Strome, and Zegras have noticeably lower win rates in unclean draws.
Other Things I’ve Noticed
- The frequency with which players get kicked from the faceoff circle is almost entirely dependent on the referee/linesmen group for that game. For example, in game #2 against the Golden Knights, only 1 player was kicked out of the faceoff dot the entire game. However, in game #7 against the Rangers, 18 players were thrown out of the dot. And the very next night in game #8 against the Devils, there were 20 thrown out. Not coincidentally, one of the linesmen, Mark Shewchyk, worked both of those games.
- It is not always obvious who wins the faceoff. A few times each game my own opinion is wrong when compared to the official game sheet. The video below is an example from the Rangers game. From the broadcast view, it looks like a clean Ducks win, but the Rangers were actually credited with the win here. My assumption is that the Rangers center poked the puck forward to the Ducks’ side, but it is difficult to tell from this angle.
Key Stats
I know this was a big data dump, but with this being the introduction to this project, I wanted to cover all of the variables that I’m tracking, even if they don’t seem to be that important. I will summarize my top insights here:
- Leo Carlsson is still young, but a 32.46% faceoff win percentage is pretty brutal. It forces him and the rest of his line to chase the puck more often. He should improve over time, but it’s difficult to trust him to win draws in certain situations.
- Mason McTavish gets kicked out of faceoffs too often. His overall win percentage (48.30%) isn’t bad, but it his effective win percentage (46.12%) is worse because he forces his wingers to take draws for him.
- Ryan Strome is the only regular right-shot center the Ducks have, and he is actually worse on what is supposed to be his strong side. In a center group full of lefties, Strome should be the guy who can win draws on the right side of the ice, yet somehow he is even worse than his teammates as he’s only won 36.80% of those draws.
- Anaheim has passable faceoff win percentages on special teams, but their win rate at even strength (41.17%) is very poor.
- With the current makeup of centers, the Ducks are very bad at winning draws on the right side of the ice (36.78% win rate). They also are not able to have centers on their strong side as often as their opponents (57.58% vs. 63.77%).
- The Ducks do not take advantage of some of their better faceoff opportunities. They only win 32.76% of draws when their opponents ice the puck (opponents win 59% of draws when Anaheim ices the puck). They also only win 42.86% of draws when the opposing center is kicked out of the circle (opponents win 65% of draws when a Ducks center is kicked out).

Leave a reply to Offseason Targets: Face-off Specialists – All Mighty Hockey Talk Cancel reply