
Alright, I’m going to need you all to buckle up for this one – it’s going to get pretty nerdy in here.
Faceoffs are a foundational aspect of the sport of hockey. At the start of every period, and after every whistle, there is a faceoff that helps determine which team will have immediate possession of the puck. The importance of faceoffs has been a controversial topic in hockey circles, in part because it is challenging to quantify the value of them beyond who wins and loses them. Teams gain and lose possession of the puck so often throughout a game of hockey that people often forget who started with the puck in the first place. If I were to ask someone which team won the most recent faceoff 30 seconds after it took place, chances are that person would simply just guess. In that regard, they don’t seem that important.
I want to take a deeper look at faceoffs, specifically through the lens of the Anaheim Ducks. The Ducks are a very poor faceoff team as currently constructed. Last season, they won only 46.7% of faceoffs (NHL average is 50%), which ranked them 29th out of 32 teams. Two of their best faceoff men from last season were traded to Edmonton at the trade deadline (Adam Henrique and Sam Carrick), meaning the team will likely be even worse than last year. Here are last season’s faceoff numbers for the Ducks’ current centers:
- Mason McTavish – 51.7%
- Ryan Strome – 46.2%
- Isac Lundestrom – 44%
- Trevor Zegras – 38.1%
- Leo Carlsson – 34.8%
I honestly think it’s safe to say that this is currently the worst faceoff team in the NHL. Of course, young guys like Carlsson, Zegras, and McTavish will improve over time, but at the moment, it doesn’t look pretty.
I wanted to take a look at where this hurts the team the most, but first, we should learn some things about faceoffs.
Faceoff Basics:
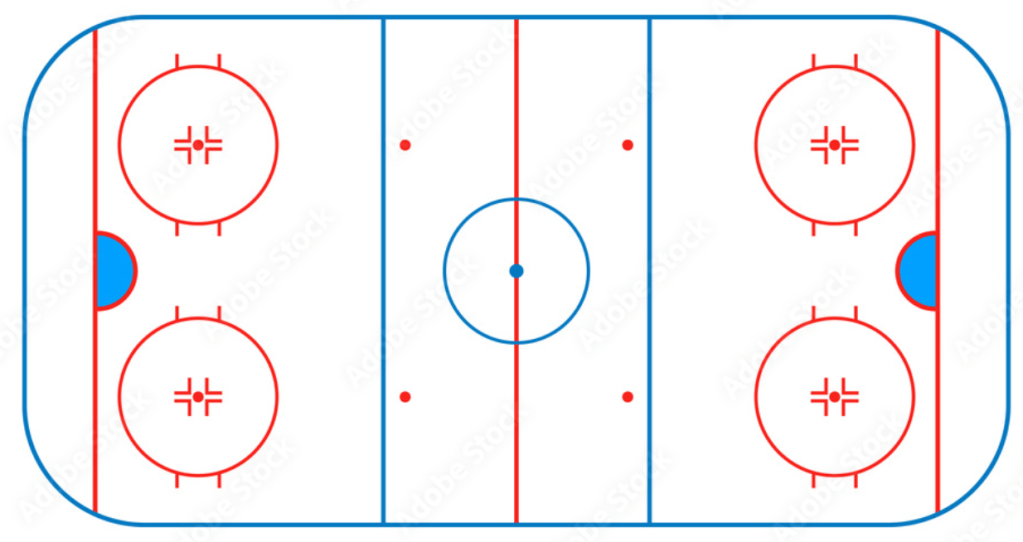
There are nine faceoff dots on a hockey rink: one at center ice, two on each end of the ice in front of each goal, and two on each side of the ice between the bluelines. There is a long list of conditions that determine which faceoff dot is used for a given faceoff, but I won’t bore you with those details (yet).
The location of the faceoff actually does make a difference as to which player is favored in winning the draw. If you are right-handed, you are considered to be on your “strong side” on the right side of the ice. So if you are attacking from left to right on the diagram above (you are facing the right goal), the faceoff dots on the bottom of the diagram are on your strong side. And the opposite is true for lefties. For the most part, teams don’t get to decide which side of the ice a faceoff is taken, but there are certain times when that does happen (we will get to that a little bit later).
Teams will usually send out specific players to take faceoffs depending on where they take place. In the offensive/attacking zone, they will regularly send out one of their better offensive lines since they are closer to the opposing goal. In the defensive zone, teams will usually choose a reliable defensive line that can defend their own goal in case the faceoff is lost.
So when does winning a faceoff actually matter? I think almost everyone would agree that it is better to win a faceoff and gain possession rather than lose a faceoff and give possession to the other team. But possession changes so often that it doesn’t seem like it would matter much. If you lose the opening faceoff of a game at center ice, does that really negatively affect your team? Not really. The chances of that faceoff loss directly resulting in a goal against are nearly zero.
The game of hockey is so chaotic and seemingly random that it is hard to imagine how winning a faceoff can noticeably increase your chances at scoring a goal. So when is the game less chaotic with fewer changes in possession? When there are fewer players on the ice and when there is a man power advantage. At even strength (5 skaters on each side), there is so little room to skate and maneuver that you can’t help but run into opponents and lose the puck. But when it’s 4-on-4, 3-on-3, or a power play, there is more room, which allows you to hang onto the puck more, making initial possession that much more valuable.
Special Teams:
During a power play, possession is incredibly important because one team has an extra player (or two) over the other team, meaning there is at least one player open during the entire play. If penalty killing units gain possession of the puck, they usually just send it down the ice to relieve pressure. It is very challenging to make plays when you are a man down, so the prudent play is to get rid of the puck. Alright, possession is important, but just how much do faceoffs matter on power plays?
There are two unique aspects about the first faceoff of a power play. First, when you draw a penalty, the initial faceoff after the whistle always takes place in the offensive zone (there are certain circumstances where it does not take place in the offensive zone, but it is rare). Second, the team with the power play also gets to choose which side of the ice the faceoff is taken on. So if your best faceoff man is right-handed, you will choose to take the faceoff on the right side of the ice. If the best faceoff man on the penalty killing team is also right-handed, then they are immediately at a big disadvantage on the draw, as that would be their weak side. You can probably get away with having one good faceoff guy on your power play, but on the penalty kill, you would ideally want both a lefty and a righty depending on the matchup for that specific game.
Winning the opening faceoff on the penalty kill seems like a big deal. It usually leads to your team clearing the puck up the ice, wasting 15-30 seconds of the power play. Entering the offensive zone with possession is also difficult, so it could lead to wasting even more time if the team on the power play has trouble getting the puck in the zone. While the other faceoffs on a power play are also important, they do not have the unique feature of the attacking team choosing the side, which makes the first faceoff extra valuable.
Hopefully that all made sense because we are about to take the nerdiness level up a notch.
Statistical Analysis of Faceoffs on Special Teams:
All of that previous analysis was logical, but I want to take it a step further and attempt to show the impact of faceoffs on special teams through statistical analysis.
My first instinct was pretty basic. Theoretically, if my hypothesis is correct, the teams that have a better faceoff percentage on the power play should have a higher power play conversion rate (power play percentage or PP%). And the same goes for the penalty kill (penalty kill percentage or PK%). I took every team’s PP% and used Money Puck’s team statistics page to input their faceoff win percentage on the power play (specifically 5-on-4). I did the same for their penalty kill statistics. I then plugged these numbers into Radiant (a browser interface for R) to see if there was any correlation between them. Here are the graphs that it gave me (I will explain them below):
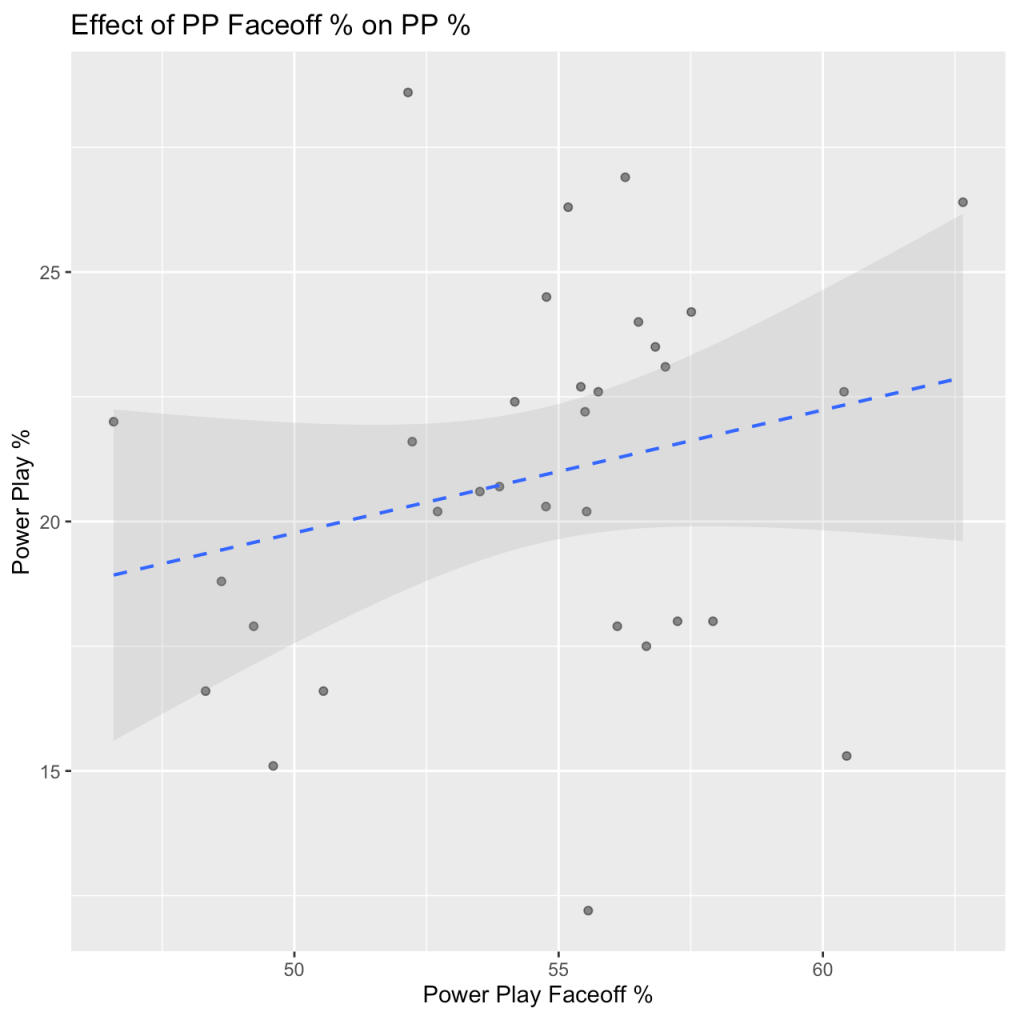
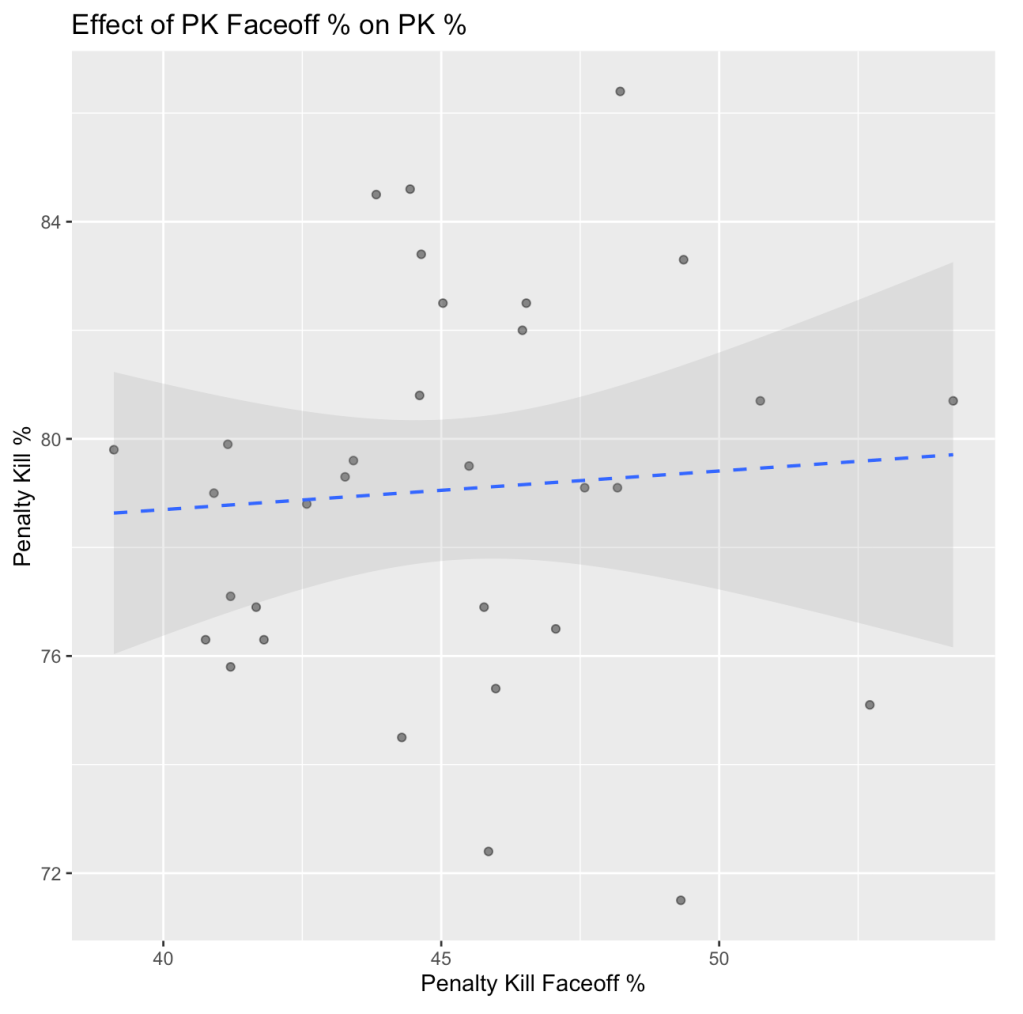
Before I analyze these graphs, I want to quickly point out a couple of things. You will notice that the average power play faceoff percentage is well above 50%, which does illustrate that the attacking team gets a faceoff advantage on the power play. The average power play percentage is around 20%, meaning teams score about 1 out of every 5 chances on the power play. This also means that the average penalty kill percentage is approximately 80%.
Each dot on these graphs represents one of the 32 teams in the NHL. Their place on the x-axis (horizontal axis) represents their faceoff efficiency in each situation. Their place on the y-axis (vertical axis) represents their goal conversion efficiency in each situation. The blue dotted-line on each graph is the regression line/trend line/best fit line. It represents the general relationship between the two variables as you move across the graph. As you can see, there is some positive relationship between the two variables, but not as much as I had hoped for (especially on the penalty killing graph).
There is also a number that tells us how correlated these variables are. Naturally, it is called the correlation coefficient. This coefficient is on a scale from -1 (perfectly negative/inverse correlation) to +1 (perfectly positive correlation). A coefficient of 0 means there is no correlation at all in either direction (for more information on the correlation coefficient, check out Investopedia). The formula to calculate this number is complicated, but thankfully I have a computer program to do that for me. It computed the correlation coefficient for the relationship between PP% and Power Play Faceoff % to be 0.24. And the coefficient for the relationship between PK% and Penalty Kill Faceoff % came out to 0.07. As you can see, while both results are above 0, neither of them is particularly strong, and it matches the graphs above.
Back to the Drawing Board
At first, I was disappointed by this result, but then I thought about it some more. Goals are a relatively rare event in hockey. Power play goals are even rarer because a small percentage of each game is played on the power play. You can even argue that goals are somewhat random because it doesn’t just depend on your own execution of a play, it also depends on the goalie making the save or not, which is totally out of your control.
So if we want to decrease the randomness created by an opposing goalie, what numbers can we look at instead? The answer is expected goals. Expected goals ignore the result of a shot and simply focus on the factors that a team can control. Sometimes that point blank opportunity hits the knob of the goalie’s stick and doesn’t go in. And sometimes that lazy shot from the blueline just floats in over the goalie’s shoulder. If you had the option, you would rather have that point blank opportunity over the shot from 60+ feet away because the odds of it turning into a goal are better, even if it doesn’t always work out that way (for more on expected goals, check out one of my recent posts). At the end of the day, your job on the power play should be to create as many opportunities as possible because that increases your chances at scoring.
How should we use expected goals in this analysis? An efficient power play generates many quality chances in a short amount of time. This sounds like the perfect time to use expected goal rates. For the power play, this can be expressed as Expected Goals For per 60 Minutes (xGF/60). And for a penalty kill, we want to suppress offense, so we can use Expected Goals Against per 60 Minutes (xGA/60).
OK, this seems like it could work. Let’s use the same strategy as the first go around, but let’s replace special teams conversion rates with expected goal rates.
Note: I attempted this analysis with expected goal numbers from both Natural Stat Trick and Money Puck. Both results were relatively similar, but I went with NST for the final analysis

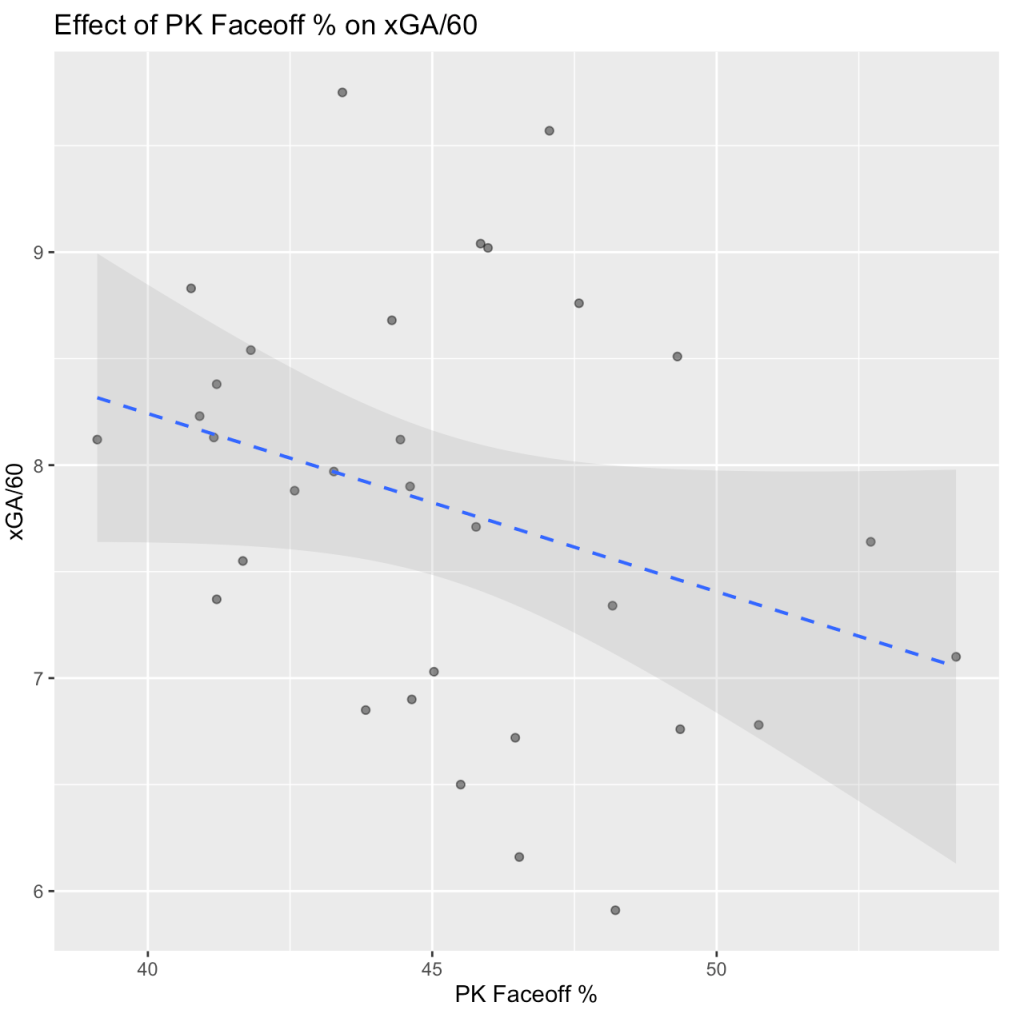
Now that looks much better. It still isn’t perfect, but it definitely seems like there is a strong relationship here. What does the correlation coefficient say? The power play graph has a coefficient of 0.57, significantly stronger than the first attempt. And for the penalty kill graph, the coefficient is -0.31 (remember that there should be a negative relationship between these variables, which is why the coefficient is negative). So it isn’t quite as strong as the PP relationship, but it is still much stronger than our first attempt.
These results don’t necessarily guarantee that faceoff percentages have a big impact on expected goals on special teams, but it certainly does appear that there is some kind of relationship between the two. Logically, it makes sense. Winning that faceoff on the penalty kill allows you to kill the clock, meaning there is less time to generate expected goals. Also, teams have set plays on the power play after a faceoff win. A set play is especially dangerous because everyone on the offensive side will know exactly where to go to execute the play, forcing the defense to react. Winning a faceoff on the penalty kill negates that threat and throws the game back into chaos for the power play. With all of that being said, I am reasonably confident in my hypothesis that winning faceoffs improves your performance on special teams.
How Does this Affect the Ducks?
I’m glad you asked.
I mentioned earlier that the Ducks traded away two of their best faceoff men. Both were regular penalty killers, often taking the faceoffs in those situations. How much did their absence affect the team? The Ducks finished the season with a PK% of 72.4%, second to last in the league. That’s pretty bad, but believe it or not, it got much worse after Henrique and Carrick were traded. In 21 games after they left, the Ducks’ penalty kill was operating at an abysmal 64%. Now, this isn’t solely due to faceoffs. Henrique and Carrick were two of the Ducks’ best penalty killers, meaning their departure forced worse penalty killers to take their minutes. That definitely had something to do with it, but the faceoffs cannot be ignored.
Anaheim’s power play wasn’t much better. They finished the season at 17.9%, which was 25th in the league. At the moment, Mason McTavish is really the only option the Ducks have to confidently win a faceoff on the man advantage. Like I said earlier, you can probably get away with having one good faceoff man on the power play, especially because he can take draws on his strong side.
Overall, the outlook for next season is not pretty when it comes to faceoffs. The Ducks only got worse with the departure of two key players last season. Losing faceoffs at even strength is one thing, but losing them on special teams is another matter. I think McTavish is good enough at faceoffs to give the power play a chance to keep the puck in the offensive zone and generate chances, but the penalty kill is definitely a concern of mine.
The Edmonton Oilers’ power play is already lethal as it is, but if Leon Draisaitl is pretty much guaranteed to win the faceoff, then you are just making them that much more difficult to deal with. Of course, systems and personnel are also very important on the penalty kill, but you are looking for any advantage you can get, and when it comes to faceoffs… the Ducks don’t seem to have it. I’m sure Ducks’ GM Pat Verbeek is expecting his young centers to improve, but it would have been really nice to add one or two reliable faceoff options to help them out (Kevin Stenlund was my top choice for this role). There is still time to add somebody, but there aren’t many options available. As it stands, I predict that the team’s faceoff woes will continue and it will be a significant detriment to the penalty kill.

Leave a reply to Anonymous Cancel reply