On my recent “Offseason Targets” posts, I frequently referenced advanced statistics based on the concept of “expected goals.” In the deeper, nerdier sects of hockey fandom, this is a relatively common analytic. However, for the regular fan, this is not common knowledge.
After my right-shot defensemen target post, my girlfriend asked me to explain what an expected goal is. I did my best to walk her through it, and she grasped it by the end of my explanation. I thought that if I could successfully explain it to her in words, I could do an even better job doing it through text and graphics. This piece will be dedicated to helping all of you better understand what an expected goal is and why it is a useful tool in assessing players and teams.
What is its Purpose?
Not all shots are equal. An expected goal places a numerical value on an unblocked shot attempt. The shot on goal counter is nice, but it counts all shots equally. If we want to better understand which team is generating better scoring chances, then we must figure out a way to assign values to each shot.
Before I go into how to do that, I want to explain where the “expected” part of the term comes from. In statistics, “expected value” is an important concept to understand. Like its name implies, it is the predicted (or expected) value of some variable. For example, if you were to flip a coin ten times, what is the expected/predicted value of the number of times the coin comes up tails? Well, there is a 50% chance it comes up tails on any flip, so if you flip it ten times, you expect that it lands on tails five times. You won’t always observe that expected result, but it is the long-run average if you were to perform the experiment over and over and over again. If you reduce the number of flips to one, then how many “expected tails” would you have? The answer would be 0.5. And if you simply flip the coin one more time, then you have now accumulated one whole “expected tails” through two flips (0.5 + 0.5). Each subsequent flip would then add another 0.5 expected tails to your expectations. The important thing to remember is that expected value is not a concrete result or answer, it is a predicted value of an action that can accumulate over repeated attempts.
Ok, hopefully that made some sense, now let’s get back to figuring out how to put values on shot attempts. The most basic version of calculating expected goals (or xG) is to use historical data based on shot location. Let’s use this graphic to explain how this works:

If a player shoots the puck from X toward the goal on the left side of the graphic, how do we figure out the expected value of that shot? Let’s pretend that exactly 1% of shots from that spot become goals. This would imply that we need to take 100 shots from that location to expect to score 1 goal. This means that each individual shot from that spot is equal to 0.01 expected goals (1% = 0.01 xG, 25% = 0.25 xG, etc.).
The next step is to understand how accumulating expected goals works:
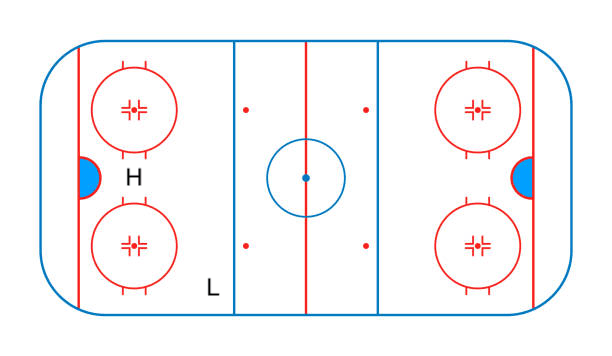
Now we have two shot locations on the map: L (low-danger shot) and H (high-danger shot). H is much closer to the net, so you would expect the value of a shot from that location to be much higher than a shot from L. Let’s keep the historical shooting percentage at L at 1% like the previous example (0.01 xG per shot). For H, we can pretend that shots from that location have a 20% chance of becoming goals (0.2 xG per shot). If a team takes 5 shots from L in a period and 3 shots from H, then they would have generated 0.65 expected goals (0.01 + 0.01 + 0.01 + 0.01 + 0.01 + 0.2 + 0.2 + 0.2 = 0.65). It is as simple as adding the values of each individual shot attempt together.
The beauty of expected goals is that it counts both the quantity AND the quality of shot attempts. This makes it much more descriptive than shots on goal, giving us a better picture of how a game is going or how a team is playing.
What Can We Use xG For?
Expected Goal Share/Percentage
One of the most popular statistics that uses expected goals is expected goal share (expected goal percentage or xG%). This stat measures what percentage of the total expected goals belong to your team. Let’s bring back our last graphic to help explain:

Team Expected Goal Share
In the first period, Team A took 2 shots from H (0.2 xG per shot) and 10 from L (0.01 xG per shot), which comes out to 0.5 xG. Team B took 1 shot from H and 5 from L for a total of 0.25 xG. In total, there were 0.75 expected goals in the first period (0.5 + 0.25 = 0.75). Team A had 0.5 of the 0.75 xG, so they had a 67% expected goal share (or xG%). You divide 0.5 (your own xG) by 0.75 (total xG) to get your own share. This means that Team B had a 33% xG% (0.25 / 0.75) because Team A’s xG% and Team B’s xG% must add up to 1 (or 100%). This also means that the average xG% has to be equal to 50%. This gives us a great baseline to tell if a team’s xG% is above average or not. In terms of a single game, you would prefer to be above 50%, as that would mean you generated more expected goals than your opponent. xG% can also accumulate over the course of a season. So if you have played 50 games and your total xG% is at 55%, then that is a great sign that your team is controlling play.
Individual Expected Goal Share
Expected goal share can also be calculated as an individual statistic. It is measured by the amount of expected goals for when the player is on the ice versus the amount of expected goals generated against his team when that player is on the ice. An individual player does not need to take the shot himself to get credit for the expected goals generated from the shot. Some people would point that out as a fault of the stat, but at the end of the day, you want to control the play while you are on the ice, and this stat measures what happens while you are in the play. There are ways to add more context to an individual player’s xG%. For example, if I had a 60% xG% when I play with Connor McDavid and a 40% xG% when I don’t play with McDavid, then that might signal that McDavid is carrying me, especially if McDavid has a 70% xG% away from me. It is also important to compare xG% to other players on the same team. A player with a 52% xG% would usually be considered good, but if the team average is 55%, then maybe that player is actually bringing his team down a bit.
Expected Goal Rates
Converting expected goals to a rate statistic allows us to measure how efficient a team or player is at generating or preventing expected goals. If a team generated 2 xG when Player X is on the ice and 3 xG when Player Y was on the ice, you would assume that Player Y had the better performance. That is one way to look at it, but what if I told you that Player X generated those 2 xG in 5 minutes of ice time, whereas Player Y generated that 3 xG in 20 minutes of ice time? That changes the picture a little bit. Yes, Player Y generated more in total, but Player X did better on a per minute basis.
Let’s convert those numbers into a rate statistic. For Player X, you divide 2 xG by 5 minutes to get 0.4 xG per minute. For Player Y, you divide 3 xG by 20 minutes to get 0.15 xG per minute. Now it looks like Player X was doing more while he was on the ice than Player Y. Those xG per minute numbers are pretty small, and in reality, they are even smaller (Trevor Zegras led the Ducks with approximately 0.0465 xG per minute at even strength last season). To make the numbers make a little bit more sense, let’s multiply it by 60 to get expected goals per 60 minutes (xG / 60 or xG per 60), keeping in mind that 60 minutes is the length of a regulation game. For Player X, he generated 24 expected goals per 60 minutes, and Player Y generated 9 expected goals per 60 minutes. Using Trevor Zegras as a real example again, he generated 2.79 expected goals per 60 minutes. We now have a number that lets us compare the efficiency of players when it comes to generating expected goals when they are on the ice. The same can be applied to preventing expected goals, which is just as important. To make things clearer, we can express expected goals generated per 60 minutes as xGF/60, and expected goals against per 60 minutes as xGA/60.
Flaws and Concerns
Different Models and Missing Variables
Earlier in this post, I used the most basic version of an expected goal model. The only real variable I considered in that model was shot location. In reality, there are a lot more factors that impact how likely a shot is to go in. What kind of shot was it? Was there traffic in front of the goalie? Did the goalie have to move right before the shot? Was there a defenseman in the immediate vicinity of the shooter? How talented is the shooter? It is obviously much more difficult to quantify those variables, but some companies have their own models that attempt to account for at least some of them. Natural Stat Trick and Money Puck both have publicly available expected goal numbers, and they both likely use more basic models. Some private companies who sell data to interested parties claim to have more robust models that factor in some extra variables to create a more accurate expected goal estimate. At the end of the day, even the basic models based on shot location still provide more value than simply counting shot attempts, and they are still useful for hockey discourse and analysis.
Even Strength vs. Special Teams
Another variable that I did not mention above is the impact of special teams on expected goals. Of course, if you are up a man or down a man after a penalty, the situation on the ice changes drastically. If you were to look at a player’s xG% in all situations, special teams could bias the number you see. If that player plays a lot on the penalty kill, then his xG% will be much lower than that of a player who plays on the power play. For example, Jackson LaCombe had the highest xG% on the penalty kill for the Ducks at 11.85% (minimum of 100 minutes on the PK). Remember when I said 50% was average? That’s definitely not the case on the penalty kill. Conversely, Pavel Mintyukov had the worst xG% on the power play for the Ducks at 79.07% (minimum of 100 minutes on the PP). This is why it is makes much more sense to look at xG% at even strength, where that 50% baseline holds true.
For special teams, rate statistics like xGF/60 for the power play and xGA/60 for the penalty kill are better comparison tools than using xG%. On the power play, you want to generate as many quality scoring chances as possible in a limited time, meaning efficiency is key. It is the opposite case for the penalty kill, where you want to suppress chances from the opposing power play. xGF/60 and xGA/60 help measure efficiency and it gives you a single number to compare each player. They can also be used as a team statistic to help determine which teams do a better job on special teams, as a whole.
Teammates and Opposition
It is important to consider the players that an individual plays with and against when analyzing his expected goal numbers. I briefly mentioned it in my McDavid example earlier, but because expected goals are an on-ice statistic, the players you are on the ice with matter a lot. Just because you have good xG numbers with really good players doesn’t mean you would have good results with anybody. And you could also achieve good results by getting easy matchups against players at the bottom of the opposing lineup. Having a strong xG% is always a good thing, but factoring in who you play with and against will give you more context as to how impressive those numbers really are.
Closing Thoughts
Hopefully that was easy to follow for all of you (my girlfriend said it was, and she is always right). This was just a brief introduction into one of the most popular advanced statistics in hockey right now. It’s a tool that is used and analyzed by all organizations in the game. Each of them probably have their own way of calculating expected goals, but the purpose is the same: to try and get any kind of advantage they can over their competition. Please feel free to leave any questions or comments about expected goals below.

Leave a reply to 2025 Offseason Priorities – All Mighty Hockey Talk Cancel reply